Quantcast
Channel: Nagios Labs » Plugins
Viewing all 10 articles
Browse latest View live

Check for XI updates with a plugin

$
0
0

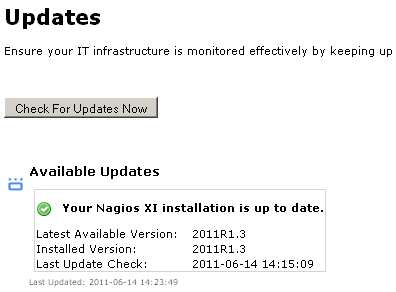
Nagios XI has always had the ability to let you know when updates to the software are available, displaying a message under the Admin area that looks like this:


This is great for just checking up on from time to time, but for most system administrators there are too many applications to be manually checking for updates, and since the whole point of Nagios is to notify you when something needs attention, it would seem far more useful to set this up in a way that would actively let you know when an update was available.

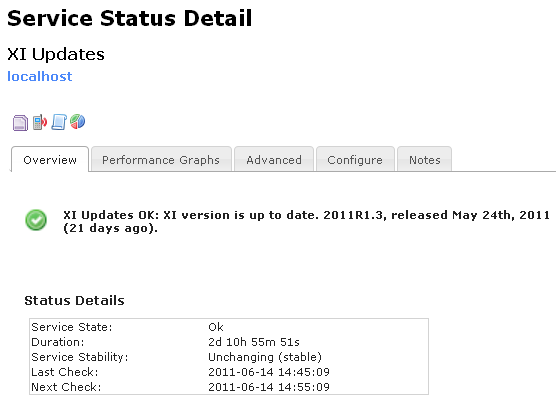
The solution for this was to re-implement the software update check as a Nagios check plugin, separate from the page code.  This means that you can now set up a Nagios service to watch for software updates to XI, and get alerts when a new version comes out just like you would for anything else that needed attention on your network, saving you time and making it more likely that you will actually remember to apply updates when they become available.  With that configuration, you will also have a service screen that looks like this:

While not yet present in XI by default, you can easily add this functionality to your existing installations.  Simply download the plugin here to your plugins directory (/usr/local/nagios/libexec/), make it executable (`chmod +x check_xi_updates`), and create a service for it.  You can find more information about those steps in the documentation and from a self-paced training video (customers only).


Documentation: Writing Custom Wizards

$
0
0

We’ve had some requests in past months about developer documentation for writing custom Configuration Wizards for Nagios XI.  Many admins have a large amount of devices of a specific type that they regularly need to add to their monitoring environment.  So for those needing to write their own wizard, and don’t mind getting their hands dirty with PHP development, this document and example code illustrate how to write a monitoring wizard while maintaining the integrity of the Nagios XI framework.  The example wizard utilizes a weather alerts check plugin written by Tony Yarusso.  You can find the document on the Nagios Library.


Monitoring Linux/Unix Machines Using SSH or NRPE

$
0
0

We’ve had a number of customer requests for new Nagios XI wizards that make it easy to monitor Linux/Unix machines either by SSH (using check_by_ssh) or NRPE. This is often useful in environments where Nagios admins have already installed the Nagios plugins and/or NRPE on machine in order to monitor them with Nagios Core.

Due to the requests we received, we whipped together some new wizards that help with this. Specifically, the new SSH Proxy and NRPE wizards.

And lest I forget, we also had a great community member (thanks Joshua!) document and test instructions on monitoring AIX over NRPE. We worked with Joshua to develop the NRPE wizard in a way that would work with his AIX/NRPE setup. BTW: Would you believe using Nagios to monitor AIX could save $300k+ on Tivoli licenses? :-)

New Microsoft Exchange Server Monitoring Wizard!

$
0
0

We’ve had a lot of folks ask about Nagios’ capability of monitoring Microsoft Exchange servers. There are a number of plugins that have been capable of doing so for a while now, but our customers wanted something easier. Thus, we decided to create a nice Exchange server monitoring wizard.

We’ve tested the wizard with Exchange Server 2010. If you’ve got an older version of Exchange, give it a try and let us know how it works for you!

Get the Exchange Server wizard on Nagios Exchange

Monitoring Gas Prices Using Capacity Planning in Nagios XI

$
0
0

Nagios XI is the most powerful IT infrastructure monitoring solution on the market.  You can use it to monitor virtually anything.  Although Nagios XI is typically meant for more “serious” work, you can have some fun with it as well!  I guess I have been somewhat nostalgic lately…  Do you remember when a gallon of gas used to cost less than a dollar? :)

In this article I will show you how to install the check_gas_price.py plugin, set up a dummy host, and add multiple services to it.  This will allow you to check the gas prices in the USA.  Then you may use the Capacity Planning component in Nagios XI Enterprise Edition to view the trends of gas prices in the USA.

First, download the check_gas_price.py plugin from this URL:

http://assets.nagios.com/downloads/nagiosxi/scripts/check_gas_price.py

Next, install the plugin from the Nagios XI web interface by going to: Admin --> Manage Plugins --> Choose File, then select the check_gas_price.py file and click Upload Plugin.

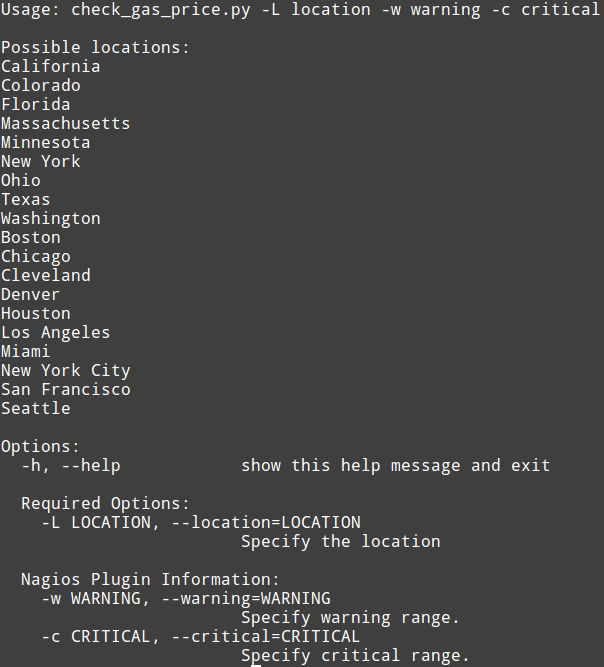
If you would like, you can view the plugins’ usage by typing in terminal:

/usr/local/nagios/libexec/check_gas_price.py -h

Your output should look like this:

Monitoring gas prices with Nagios XI - check_gas_price.py

Create a new command by going to: Core Config Manager --> Commands –> Add New.  I named my command “check_gas_price” but you can use whatever name you like.

Add command name with Core Config Manager in Nagios XI

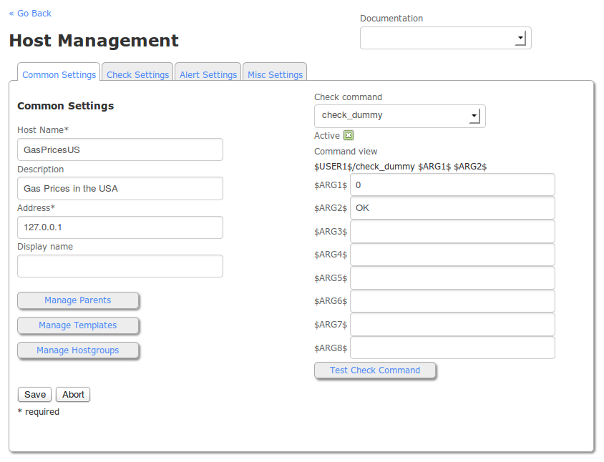
Next, create a dummy host and add some services to it for checking gas prices in the USA by selecting check_dummy from the Check Command dropdown.

Host Management in Nagios XI

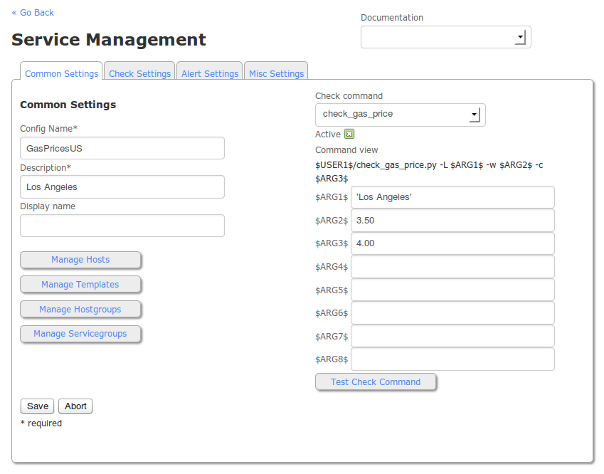
The values necessary to create a successful gas price monitor are as follows:

Config Name = The name of your “host”  (Note: in this case it is purely organizational, thus the name GasPricesUS)

Description = The name of the service as displayed by Nagios XI

$ARG1$ = Location (Note: This is limited to the list of cities and states found in the -h Help call for the plugin)

$ARG2$ = At what price would you like to receive a Warning notification?

$ARG3$ = At what price would you like to receive a Critical notification?

Service Management in Nagios XI

Note: Don’t forget to wrap the location in $ARG1$ in single quotes in case there is a space in the name.  If you don’t use single quotes, you will get syntax errors.

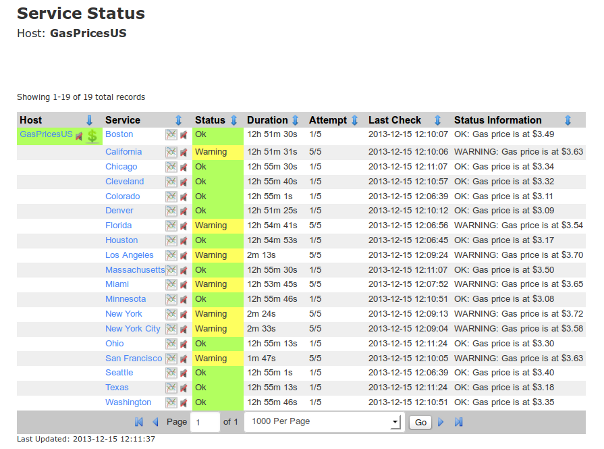
GasPricesUS Service Status in Nagios XI

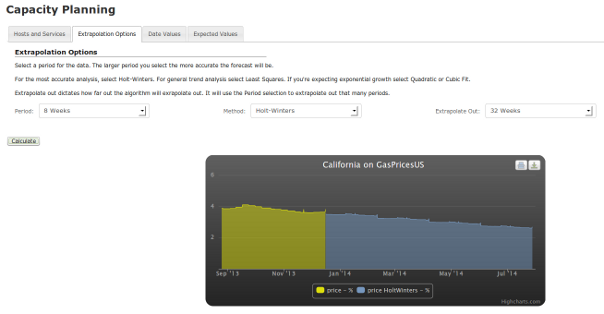
After monitoring gas prices for a good length of time, you can take the historical data that has gathered and use the Capacity Planning component to observe trends and forecast future gas prices.

Monitoring gas prices using Capacity Planning in Nagios XI

Here I used an 8 week period and extrapolated out 32 weeks.  I don’t believe the gas prices in California will ever reach $1/gallon (at least not any time soon), but I sure do like the trend that is shown on the graph. :)

If you want to learn more about the Capacity Planning component, view the documentation at the following link:

http://assets.nagios.com/downloads/nagiosxi/docs/How_To_Use_Capacity_Planning.pdf

If you want to see what other cool features are present in Nagios XI Enterprise Edition, please visit the URL below:

http://www.nagios.com/products/nagiosxi/whatsnew

Happy monitoring!

Heartbleed: One Bug to Rule Them All

$
0
0

If you’ve missed the news in the last few days, OpenSSL has been found to contain a rather large issue in it’s implementation of TLSv1.1 and TLS1.2 for versions 1.0.1 through 1.0.1f and 1.0.2-beta. Thankfully, no other versions contain this issue and due to responsible disclosure, a patch is already available in the form of OpenSSL 1.0.1g, which many distributions are already making available via standard package management, such as yum and apt.

As for the juicy details… Heartbleed is a vulnerability caused by a missing bounds check and lack of validation, with the TLS heartbeat extension, that allows for up to 64k of memory to be leaked to an attacker. This is done via initializing a TLS connection over TCP or UDP. When this connection is begun, a heartbeat is shared between the client and server to validate that they are both in good working order. If a malformed, specifically empty, heartbeat is sent, the responding client or server will attempt to copy memory from a packet that is not available and instead respond with data that was previously at the same location that the packet should have been located in memory on the victim’s system. The process is not limited to a newly initialized connection and may be repeated at any point in time with existing connections as well. This could result in leaked memory containing rather benign large chunks of empty memory or severe issues such as private encryption keys, session id’s, passwords, and anything else that might be in the victim’s memory.

Just to clarify, this can affect both clients and servers. Yes, your Android phone’s web browser is just as affected as your Apache web server or OpenLDAP server. So, while updating your OpenSSL version, firmware and operating system are extremely important, one must also consider applications and services that ship with internal versions of OpenSSL or include libraries with compilation that standard updates may not correct.

Resolving this on most systems including current CentOS, RHEL, and Debian based distributions can already be found via standard updates with the included package managers. Systems that do not currently provide updated versions of OpenSSL can be manually updated by building version 1.0.1g from source or building previous versions with the -DOPENSSL_NO_HEARTBEATS flag. In the case of embedded systems such as switches, routers and phones, a firmware update request may have to be made to the vendor directly.

After seeing the large effect this particular bug is having worldwide, we decided to modify existing proof of concept code and provide Nagios users with an automated way to check your systems. Through a Nagios plugin, you can now validate whether your TCP services are vulnerable to the bug with both TLSv1.1 and TLSv1.2. Soon to be implemented updates will include checking of STARTTLS vulnerabilities and UDP connections.

Without further ado, we present the check_heartbleed plugin and heartbleed testing page.

Nagios Exchange: check_heartbleed.py
Nagios.com/heartbleed-tester

Monitoring Apache Cassandra Database Nodes with Nagios XI

$
0
0

As cloud services grow in popularity, so do the networks that provide those cloud services.  Few webserver-based distributed databases are as easy to install and configure as Apache Cassandra.  Apache Cassandra is an open source distributed database management system designed to handle large amounts of data across many commodity servers, providing high availability with no single point of failure. Cassandra offers robust support for clusters spanning multiple data centers, with asynchronous master-less replication allowing low latency operations for all clients.

Cassandra relies on the Java platform, and as those of you who have tried to configure Java app monitoring most likely know, the experience can be painful.  There are a handful of plugins on the Nagios Exchange that attempt to simplify the configuration.  As these plugins rely on the Apache Cassandra utility “nodetool”, you either need to install Cassandra on the Nagios server (which is not suggested) or use an agent (like NRPE) to run the plugin script directly from the Cassandra server (which should have the nodetool utility).

The Cluster Node Check is designed to verify whether the number of live nodes is less than a specified number, and if so trigger a warning or critical alert within Nagios.

1. Download and install the NRPE agent on the Cassandra server.  Follow our linux-agent installation document below:
http://assets.nagios.com/downloads/nagiosxi/docs/Installing_The_XI_Linux_Agent.pdf

If you experience issues with the NRPE install, refer to the following troubleshooting document:
http://assets.nagios.com/downloads/nagiosxi/docs/NRPE_Troubleshooting_and_Common_Solutions.pdf

If you are not running CentOS or RHEL on the Cassandra server, you may need to compile NRPE from source:
http://assets.nagios.com/downloads/nagiosxi/docs/Source_Based_NRPE_Installation_and_XI.pdf

2. Download the Plugin:

Once NRPE is installed, you will need to run the following commands from your Cassandra server command line to download the check_cassandra_cluster.sh script.

cd /usr/local/nagios/libexec
wget https://raw.github.com/hashnao/nagios-plugins/master/check_cassandra_cluster.sh
chmod +x check_cassandra_cluster.sh
chown nagios:nagios check_cassandra_cluster.sh

3. Verify check from Cassandra Server Command Line:

It is a good idea to run the plugin locally to verify that it works, before moving on to test it from the Nagios Server.  To do so execute the following command from the command line on the Cassandra server.

/usr/local/nagios/libexec/check_cassandra_cluster.sh -H localhost -P 7199 -w 1 -c 0

You should see output similar to:

OK - Live Node:2 - 127.0.0.1:Normal,70.97,KB100.00%,940153922094527000 |     Load_127.0.0.1=KB100.00% Owns_127.0.0.1=940153922094527000

4. Configuring the check in nrpe.cfg:

In order for Nagios to execute a command on a remote server, you need to add the plugin to the nrpe.cfg on the Cassandra server.  Edit the /usr/local/nagios/etc/nrpe.cfg file with your favorite text editor by adding the following line at the bottom of the file.

command[check_cassandra_cluster]=/usr/local/nagios/libexec/check_cassandra_cluster.sh $ARG1$

Verify that “dont_blame_nrpe=1” is configured in the nrpe.cfg on the Cassandra sever as we are passing arguments to the server.

Restart xinetd on the Cassandra Server (or the nrpe service if you compiled from source) by running the following command.

service xinetd restart

Test the check from the XI server command line.  Make sure to replace <Cassandra server ip> with the IP address of your Cassandra server and also replace <ip of Cassandra node to check> with the same IP address or a different IP address of another Cassandra server.

/usr/local/nagios/libexec/check_nrpe -H <Cassandra server ip> -c check_cassandra_cluster -a '-H <ip of Cassandra node to check> -P 7199 -w 1 -c 0'

You should see output similar to:

OK - Live Node:2 – 127.0.0.1:Normal,71.54,KB100.00%,-9165324447555808428 127.0.0.1:Normal,71.54,KB100.00%

5. Add the check_cassandra_cluster command to XI:

In XI, go to  Configure -> Core Config Manager -> Commands.  Click “Add New“.

Enter “check_cassandra_cluster” for the Command Name.

For the Command Line enter:

$USER1$/check_nrpe -H $HOSTNAME$ -c check_cassandra_cluster -a '-H $ARG1$ -P $ARG2$ -w $ARG3$ -c $ARG4$'

Save changes and “apply configuration“.

6. Create a Host in XI for your Cassandra Server:

You will need to set up the Cassandra server as a Host in Nagios XI if you have not done so already.  To do so, use the following steps.

In XI, go to Configure -> Run the Monitoring Wizard.

Select a Linux Server and enter the IP address of your Cassandra server and distribution.  Select Next.

Select any services you wish to monitor and select Next.  (Note: you do not need to download the agent as that has already been done in step 2 above.)

Set your Monitoring settings and click Finished.

7. Create a service check in XI:

In XI, go to Configure -> Core Config Manager -> Services and click “Add New“.

Enter a name for the check and select Check_Cassandra_Cluster from the check Command Drop Down.

Configure the arguments:

$ARG1$:  The IP address of the Cassandra node to check
$ARG2$:  The Port that the Cassandra node is listening on (default is 7199)
$ARG3$:  Warning threshold – Integer for number of nodes or less report WARNING
$ARG4$:  Critical threshold – Integer for the number of nodes or less to report CRITICAL (must be less than $ARG3$)

Add the Cassandra sever to the check through the “Manage Hosts” button.

Continue configuring the service object as you normally would using templates, check and alert settings, etc.

Save and Apply Configuration.

The check should now be active and working.

The full documentation can be found below

Monitoring Apache Cassandra Databases with Nagios XI


If you are unfamiliar with Nagios XI, you can download the fully functional Free 60 Day Trial.

Also, Nagios World Conference takes place October 13-16, 2014. Use discount code LABS100 and save $100 on your conference pass - register today!

Monitoring Weblogic Metrics with Nagios XI

$
0
0

Weblogic is a popular Java-based application server that acts as a middleware between the application and the Java environment.  It provides a framework for developing traits such as reliability (recovering from failures), scalability (dynamic service scaling) and security (unified security system for apps).  Nagios XI has the ability to monitor various aspects of Weblogic using wlsagent as outlined in our document Monitoring WebLogic With Nagios XI. In this post I will expand upon some of those metrics, such as what they mean and why they are important.  Links to further reading will be provided where relevant.

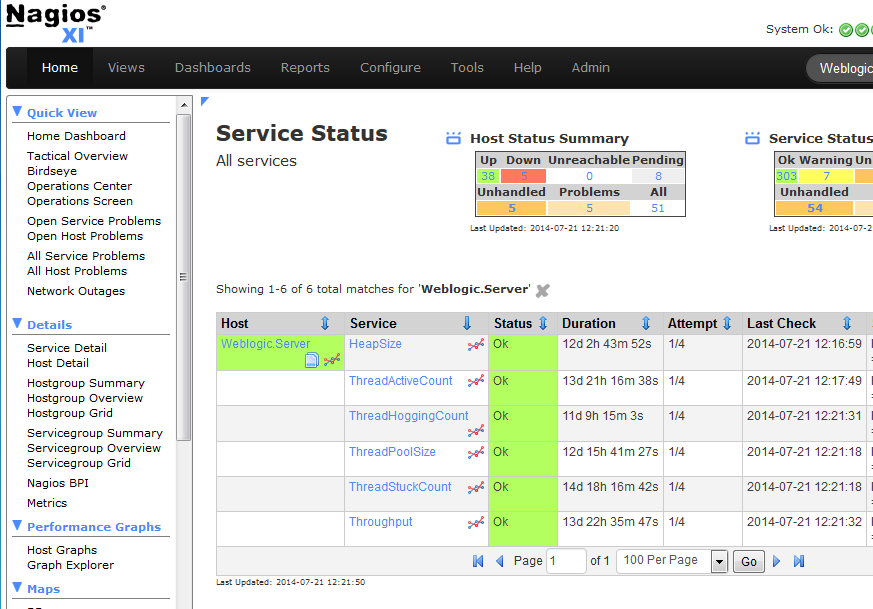
Nagios XI Service Status Dashboard

HeapSize
Current heap size in MB.  This value typically will not change on its own, as this is set (usually manually) in the java settings.  Changes in this value may be indicative of an administrator tweaking the performance settings of the JVM.

Java Heap Notes

UsedMemory
Current used memory in MB.  A fraction of the total heap, this value fluctuates with use.  Abnormally high values could indicate either increased traffic to the java application, or possibly a memory leak.  If this regularly approaches the maximum heap size, you might consider increasing that value.

ThreadPoolSize
Total number of threads in the pool.  Each thread is capable of handling a unit of work such as processing an order or verifying an email.  The bigger the pool, the more concurrent tasks can be handled.

Thread Pool Theory

ThreadActiveCount
Active thread count.  This is the number of threads currently doing work.  A high value, as with the UsedMemory metric, could indicate heavy usage of the applicaiton.  This metric is related to the ThreadHoggingCount and ThreadStuckCount metrics discussed below.

ThreadHoggingCount
Number of threads being hogged by a request for more than the execution time.  Some threads will be used by a process for a long time, which could be caused by network lag, CPU load, or a logical loop in the application.

Stuck Threads Intro

ThreadStuckCount
Number of threads that have been hogged for long enough.  After being hogged for a certain time, a thread will be marked as stuck.  This is a fairly common problem in WebLogic, although it does not always indicate a real problem.  A method that calls sleep() for 10 seconds might be marked as stuck but still be functioning properly.

Stuck Thread Detection
Stuck Thread Removal

Throughput
Mean number of requests completed per second.  This is simply a measure of how much “work” is being done per second, usually related to either transactions or thread executions.

I have covered the more popular metrics, however on the wlsagent wiki page there are examples of a few others you might be interested in.  Feel free to browse those checks, and if you have any questions don’t hesitate to contact us on the Nagios Support Forum.

If you would like to further explore features and capabilities of Nagios XI, you can download a Free 60 Day Trial to get started.

Also, Nagios World Conference 2014 takes place this October! Register here and enter discount code LABS100 to save $100 on your conference pass!


FREAK Vulnerability Tester

$
0
0

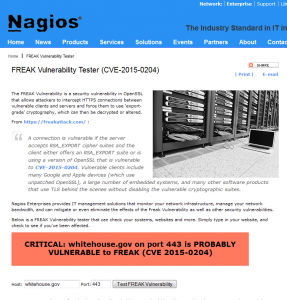
With yesterday’s disclosure of the new SSL/TLS vulnerability dubbed FREAK, we at Nagios decided to take some action to assist the community with a quick and easy tester to help determine if a server is vulnerable to (CVE-2015-0204).

If you are not familiar with the FREAK Vulnerability, here is a brief description from https://freakattack.com/ :

A connection is vulnerable if the server accepts RSA_EXPORT cipher suites and the client either offers an RSA_EXPORT suite or is using a version of OpenSSL that is vulnerable to CVE-2015-0204. Vulnerable clients include many Google and Apple devices (which use unpatched OpenSSL), a large number of embedded systems, and many other software products that use TLS behind the scenes without disabling the vulnerable cryptographic suites.


At Nagios, we take security vulnerabilities very seriously and when possible like to offer the ability to perform a quick check directly from our website.

Enter FREAK Vulnerability Tester (CVE-2015-0204)

FREAK Vulnerability Tester (CVE-2015-0204)


Nagios Enterprises provides IT management solutions that monitor your network infrastructure, manage your network bandwidth, and can mitigate or even eliminate the effects of the FREAK Vulnerability as well as other security vulnerabilities.

For most servers that are found to be vulnerable administrators should be able to update the OpenSSL package and then restart the affected services such as httpd.

If your server is running RHEL or CentOS, the following commands will resolve the security vulnerability:

yum update openssl -y
service httpd restart

If you are already using Nagios Core or XI to monitor your infrastructure, this easy-to-use plugin can notify you if your system is susceptible to the FREAK vulnerability.

Download the check_freak Plugin

If you haven’t experienced the benefits of monitoring with Nagios, be sure to check out our products page.

Monitor the End of the World (or any other event of your choosing) with Nagios XI!

$
0
0

Nagios XI is extremely flexible, perhaps more flexible than most people realize!

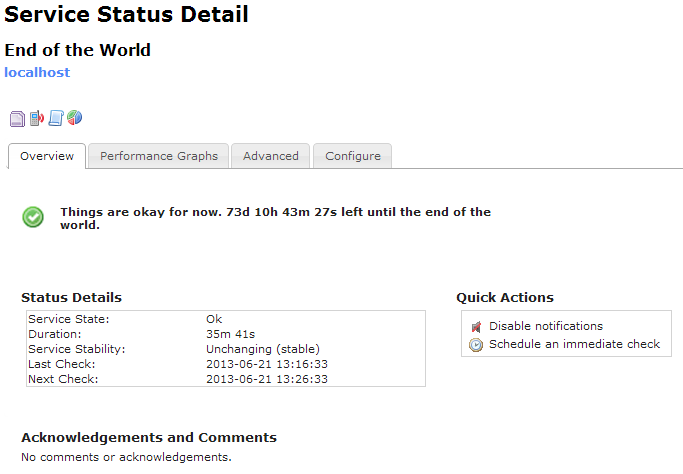
To showcase the flexibility of Nagios XI, President and Founder of Nagios – Ethan Galstad, has developed the plugin Doomsday Check  to monitor an arbitrary doomsday date (of your choosing) with customizable warning and critical thresholds.

Although this plugin may not be very practical in a networking environment, it’s fun to play around with and is definitely worth a try.


Service Status Detail


If you would like to use this plugin, simply download it here to your plugins directory (/usr/local/nagios/libexec/), make it executable (`chmod +x check_doomsday.php`), and create a service for it.

You can find more information on how to manage plugins in Nagios XI in this document. If you are an XI customer you may also watch this video.

If you are new to Nagios XI, you can test drive it free for 60 Days by downloading the trial.

Also, the Nagios World Conference is fast approaching! Register here today!

Viewing all 10 articles
Browse latest View live